This article describes how you can check the raw data by yourself, if the data in the portal is unclear.
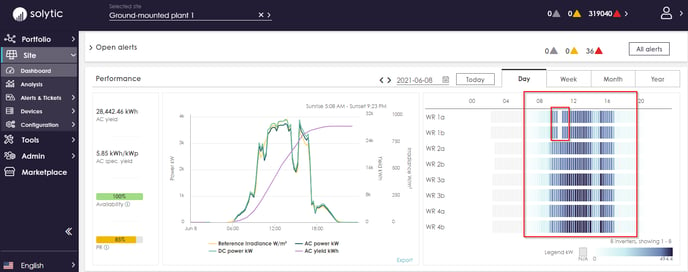
As an example, here is an error image from the demo account: On October 12, 2021, no AC power values are displayed for two inverters for a short period of time (screenshot here shows 8/6/2021):
3. From the current time of the desired date of the test, up to 30 days in the past, you can download the raw data there:
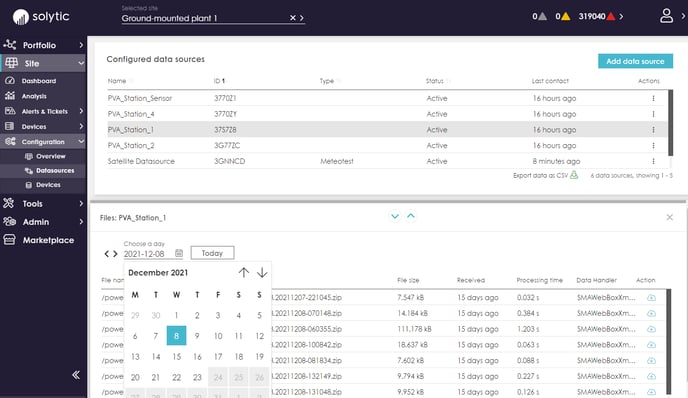
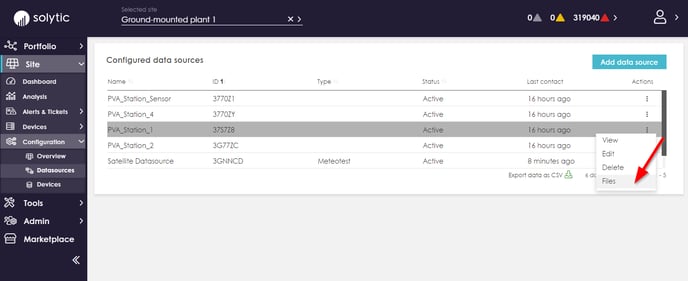
4. For each row, you can now download a file under the Action column by clicking on the download icon (marked red here):
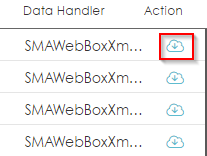
5. If the file is in ZIP format, it must be unpacked. Depending on the logger, the raw data is available as the logger has pushed it into the portal.
6. Afterwards you can open the files (e.g. CSV, XML) in Excel or another spreadsheet software and compare them with the portal data.