This article describes how to compare devices and parameters within a PV site or across multiple PV sites in your portfolio.
- Log in with your Solytic account.
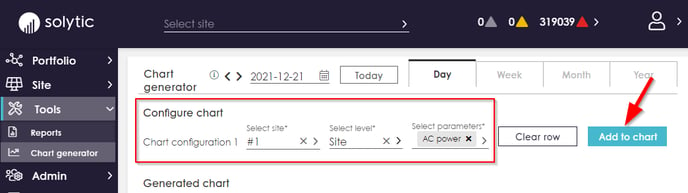
- In the menu structure, under Tools > Chart generator, select "Configure Chart".
- Fill in the required dropdowns in the "Configure Chart" section (highlighted in red). Once all dropdowns are filled in, you can click on "Add to Chart" (red arrow) to add the first configuration to the chart.
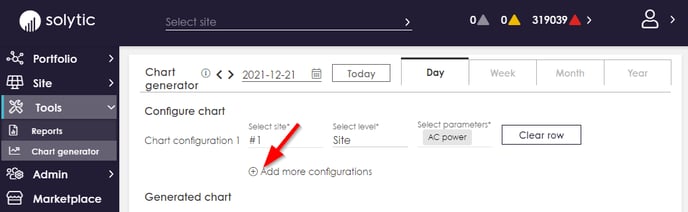
- If you want to add more configuration to the existing chart, click on "Add more configurations" (red arrow).
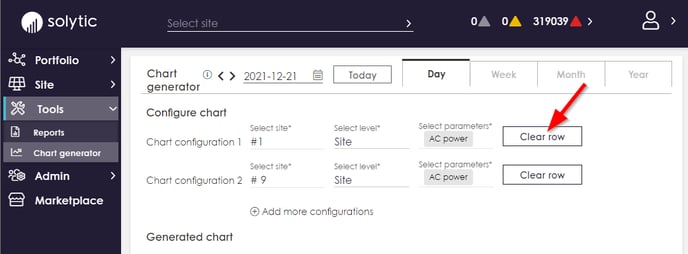
- If you want to remove an existing configuration from the chart, click on "Clear row" (red arrow).
The selected parameters are shown in the Generated Chart under the selection.